The covid19brazil R package has daily information on the number of accumulated cases and accumulated deaths for the COVID-19 pandemic in Brazil. The information available in the package is organized as follows:
-
brazil_total- Dataset with information about the new Coronavirus (COVID-19) for Brazil as a whole -
brazil_region- Dataset with information on the new Coronavirus (COVID-19) for the five regions of Brazil -
brazil_state- Information on the new Coronavirus (COVID-19) for the twenty-seven Federative Units of Brazil -
brazil_municipality- Information on the new Coronavirus (COVID-19) for the 5,570 municipalities in Brazil
Base limitation for municipalities (only for municipalities):
At the municipal level, the current day’s data may be lower than the previous day’s: this happens because the notification municipality is not necessarily the same place of residence of the notified case or death. Thus, upon completing the investigation process of each individual occurrence, the Municipal and State Health Departments have the autonomy to correct the information and pass it on to the Ministry of Health. Therefore, in all bases the current day’s data may be smaller than the previous day’s data.
Installation
To install the package, one of the two standard methods for installing packagesin R can be adopted. Directly through the cran (choosing the closest repository):
install.packages ("covid19brazil")Or even using the command below. In the latter case, the latest version of the package will be installed.
# install.packages ("devtools")
devtools::install_github ("AlexandreLoures/covid19brazil")
The update_data command
To obtain the most up-to-date version of the data on the new coronavirus (COVID-19) pandemic in Brazil, use the update_data command. Data is updated daily on Github (Dev) version, however, the CRAN version of the covid19brazil package is updated every month or two. Don’t forget to restart the R session to load the new data.
update_data ()Using the package
data ("brazil_total")

head (brazil_total)
#   region       date epidWeek population accumCases newCases accumDeaths
# 1 Brasil 2020-02-25        9  210147125          0        0           0
# 2 Brasil 2020-02-26        9  210147125          1        1           0
# 3 Brasil 2020-02-27        9  210147125          1        0           0
# 4 Brasil 2020-02-28        9  210147125          1        0           0
# 5 Brasil 2020-02-29        9  210147125          2        1           0
# 6 Brasil 2020-03-01       10  210147125          2        0           0
#   newDeaths newRecov followUp
# 1         0        0        0
# 2         0        1        0
# 3         0        1        0
# 4         0        0        1
# 5         0        1        1
# 6         0        1        1
Download, read and analyze the microdata
The purpose of this section is to analyze data on cases, deaths, proportions and geographic distribution on the COVID-19 pandemic in Brazil, made available by the Ministerio da Saude - Sistema Unico de Saude (SUS). Data are available as of 2020-01-30, when the first suspected case appeared in Brazil.
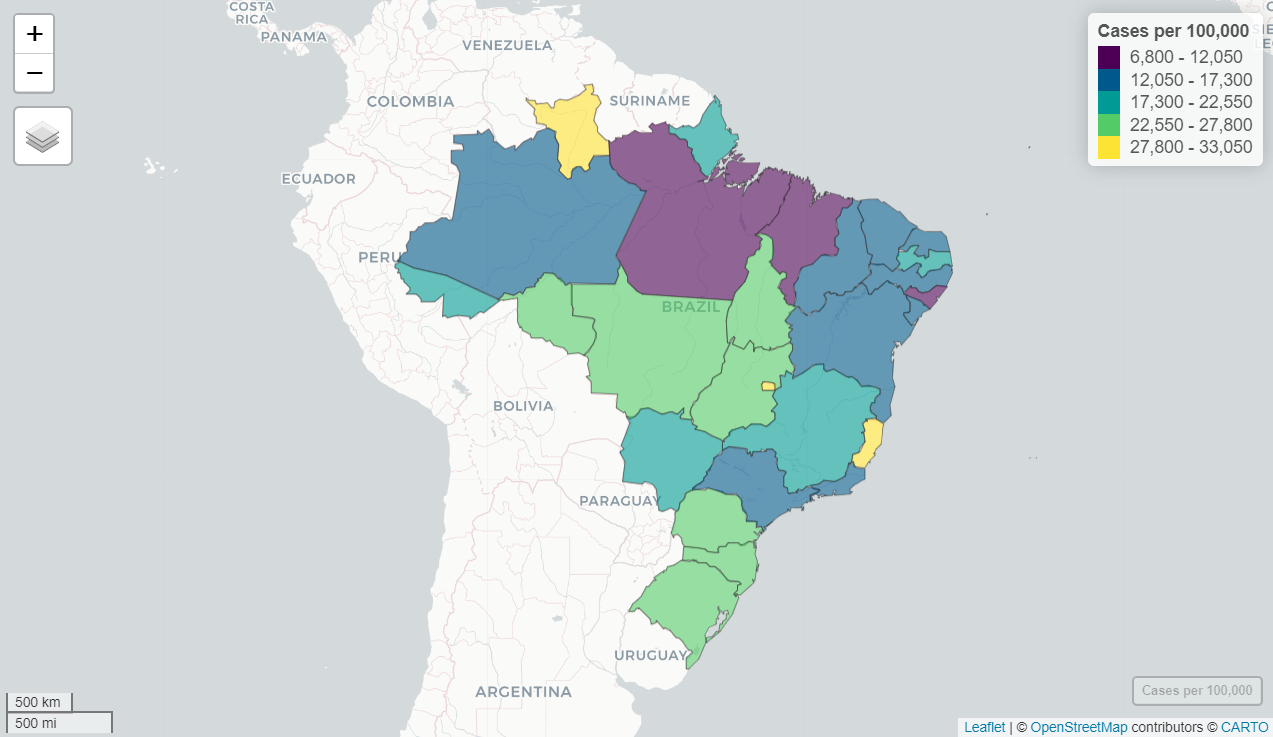
Cases accumulated per 100,000 inhabitants
The graph below shows the number of cases accumulated in each Federative Unit of Brazil per 100,000 inhabitants (data for the day 2023-03-10).
Data source: Ministerio da Saude - Sistema Unico de Saude (SUS)
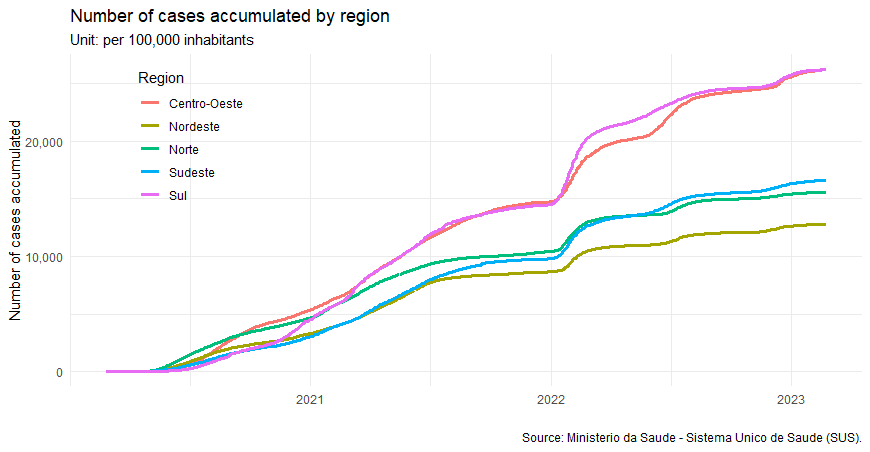
Below is the graph for the number of cases accumulated per 100,000 inhabitants for each of the five macro-regions in Brazil, information until the 2023-03-10.
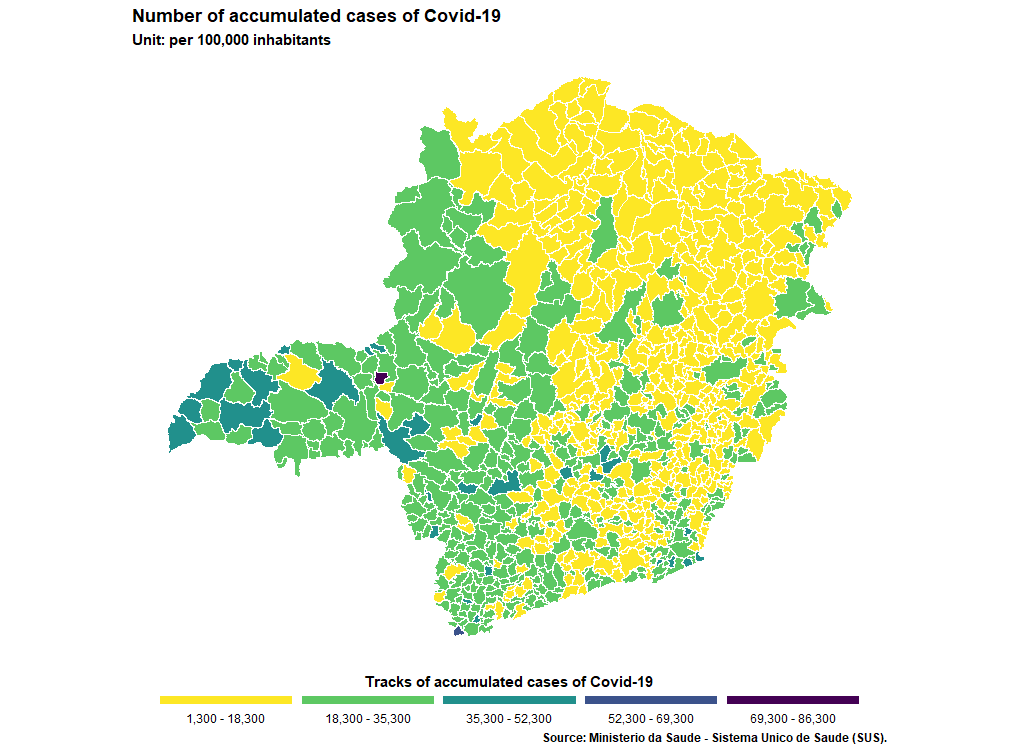
The next graph refers to the number of accumulated cases per 100,000 inhabitants for each of the 853 municipalities in the state Minas Gerais (data for the day 2023-03-10).
Deaths accumulated per 100,000 inhabitants
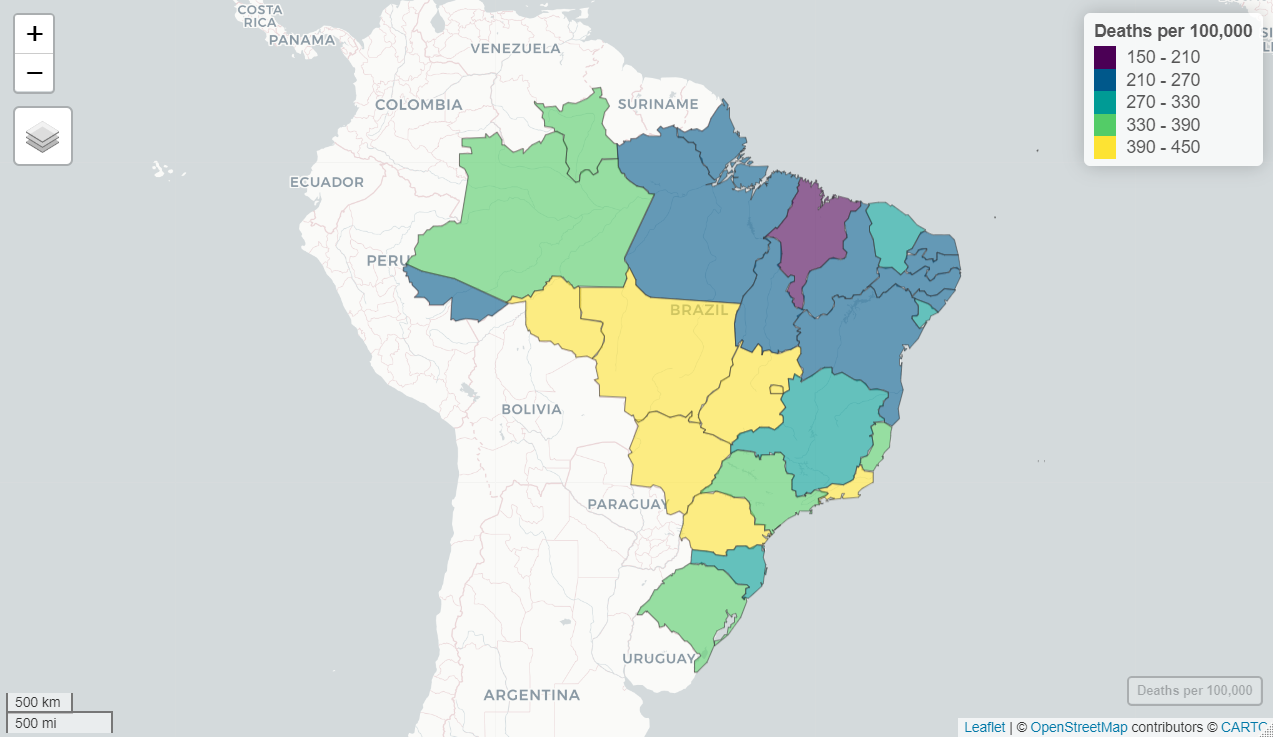
In turn, the next graph shows the number of deaths accumulated in each Federative Unit of Brazil per 100,000 inhabitants (data for the day 2023-03-10).
Data source: Ministerio da Saude - Sistema Unico de Saude (SUS)
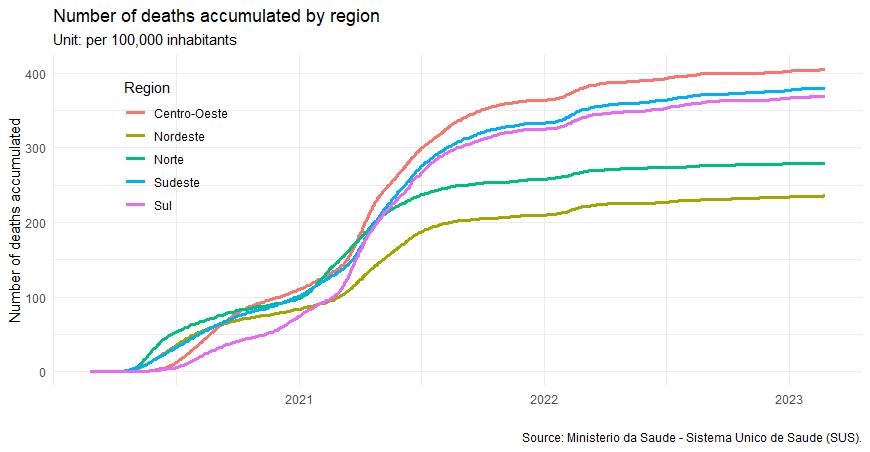
The graph below shows the number of accumulated deaths per 100,000 inhabitants for each of Brazil’s five macro-regions, information until the 2023-03-10.
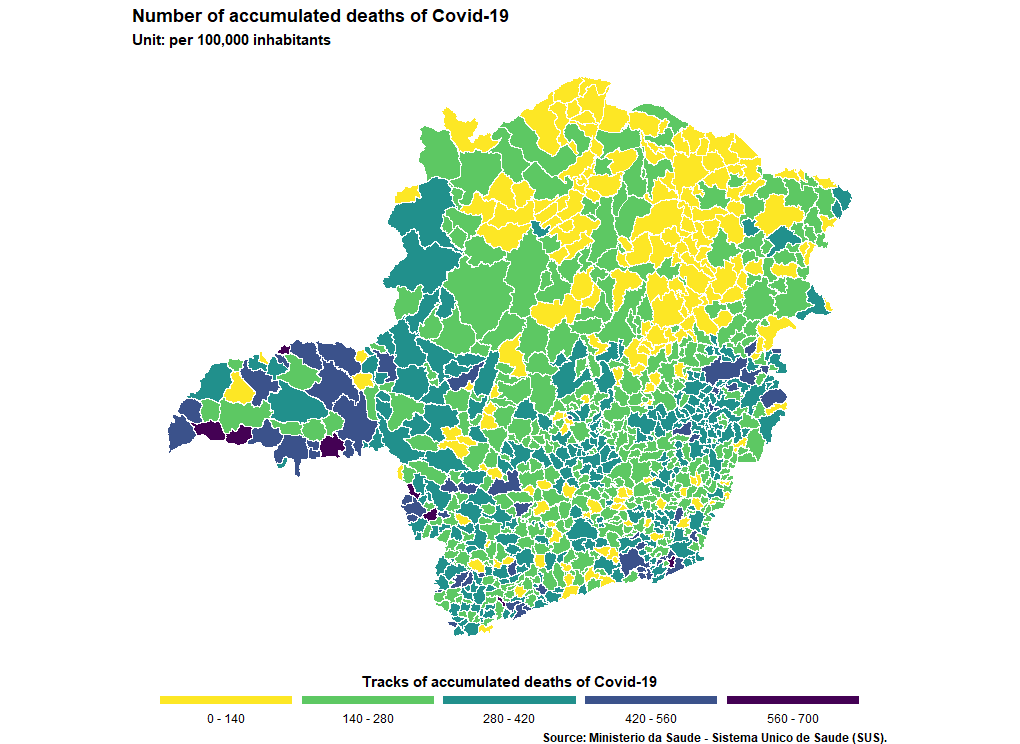
The next graph refers to the number of accumulated deaths per 100,000 inhabitants for each of the 853 municipalities in the state of Minas Gerais (data for the day 2023-03-10).
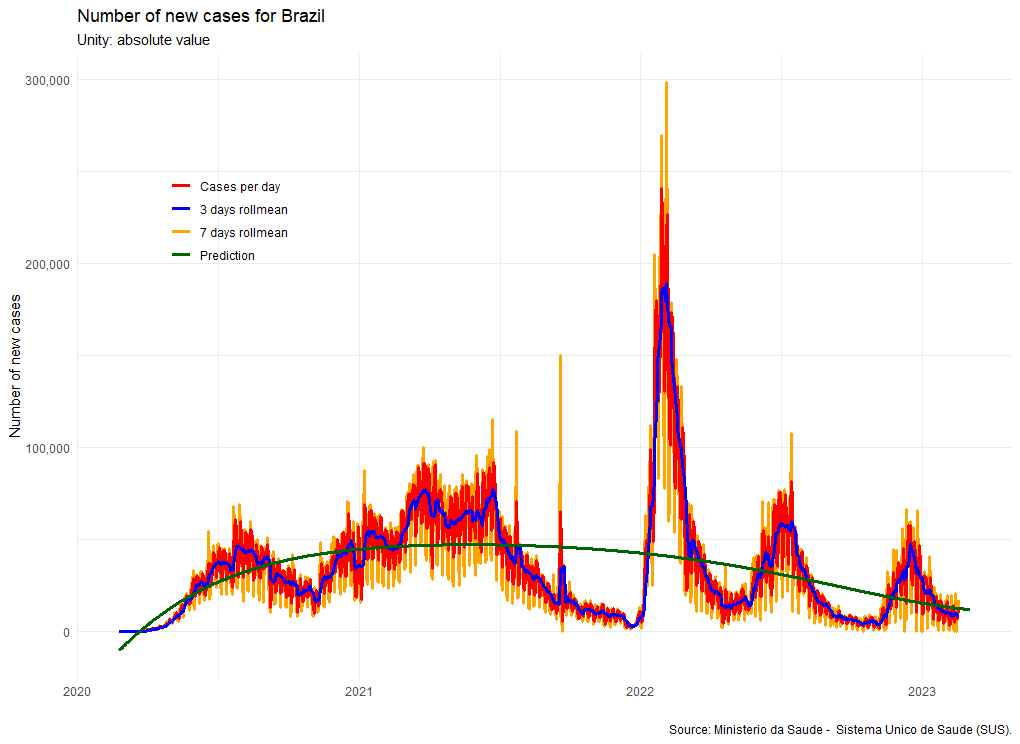
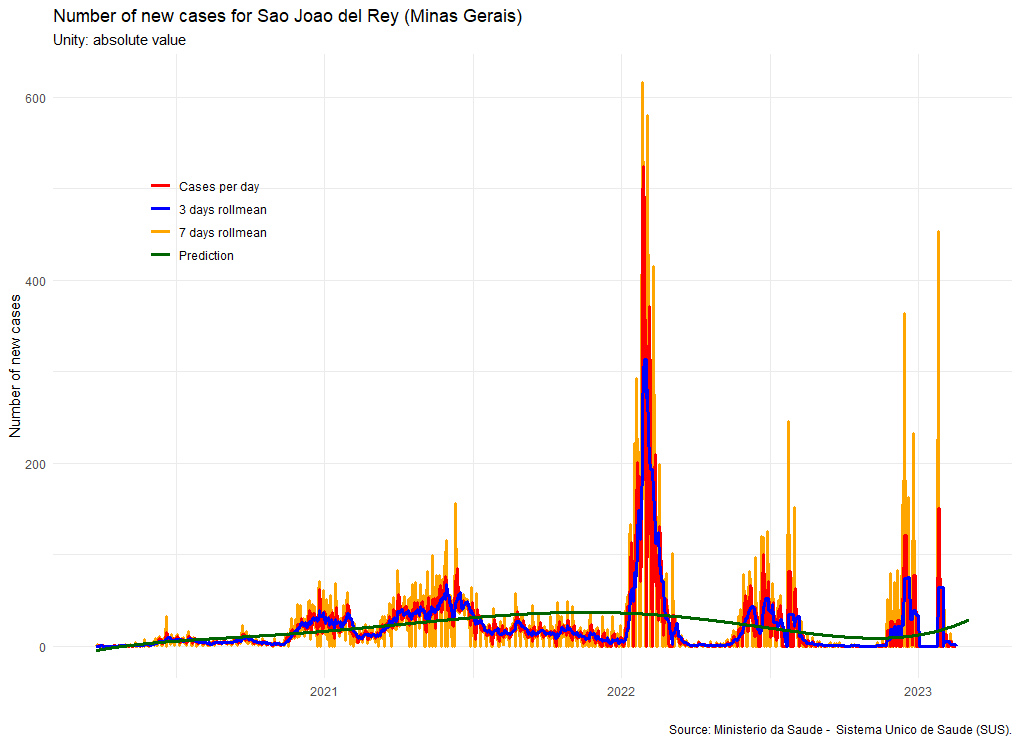
Moving averages and forecast (Polynomial interpolation)
The graph below presents the data for the number of daily new Covid-19 cases, respectively, for Brazil and for the municipality of Sao Joao del Rey (belonging to the state of Minas Gerais), a 3-day moving average, a 7-day moving average and the forecast, obtained by polynomial interpolation of degree 5, covering the entire period plus 15 days (last day of observed data is 2023-02-17).
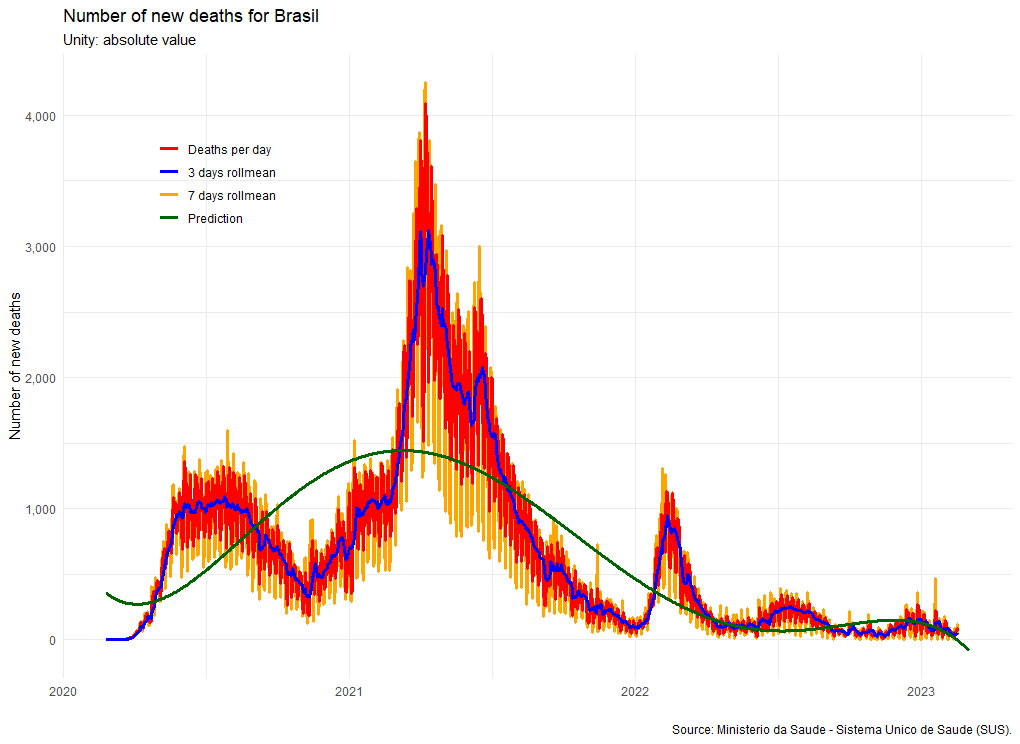
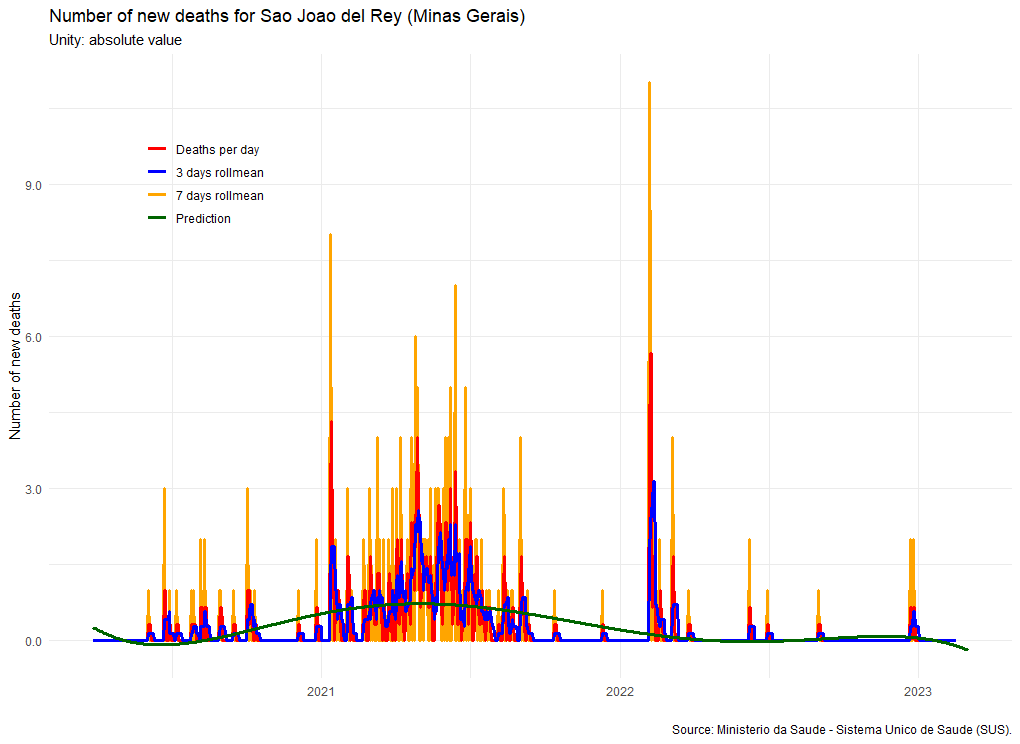
The next graph presents the data for the number of new daily deaths caused by Covid-19, respectively, for Brazil and for the municipality of Sao Joao del Rey (belonging to the state of Minas Gerais), a 3-day moving average, a 7-day moving average and the forecast, obtained by polynomial interpolation of degree 5, covering the entire period plus 15 days (last day of observed data is 2023-02-17a).